Introduction
In this lecture we will learn:
Import data from bigish csv files (MIMIC-IV).
Deposit data into an SQLite database.
Query SQLite database.
Transform in database and plot in R.
CSV file
The /mnt/mimiciv/1.0 folder on the teaching server contains the MIMIC-IV data. On my Mac, it’s at /Users/huazhou/Documents/Box Sync/MIMIC/mimic-iv-1.0.
Code in this lecture assumes that the MIMIC-IV data is available at ~/mimic.
Display content of MIMIC-IV data files:
<- "~/mimic" system (str_c ("tree -s -L 2 " , mimic_path), intern = TRUE )
 [1] "\033[01;36m/Users/huazhou/mimic\033[00m"
 [2] "├── [       2518]  LICENSE.txt"
 [3] "├── [        224]  \033[01;34mMIMIC-reduce-chartevents\033[00m"
 [4] "│   ├── [   40348871]  \033[01;31mchartevents_filtered_itemid.csv.gz\033[00m"
 [5] "│   └── [        243]  \033[01;32mreduce_chartevents.sh\033[00m"
 [6] "├── [       2459]  SHA256SUMS.txt"
 [7] "├── [        192]  \033[01;34mcore\033[00m"
 [8] "│   ├── [   17208966]  \033[01;31madmissions.csv.gz\033[00m"
 [9] "│   ├── [        606]  index.html"
[10] "│   ├── [    2955582]  \033[01;31mpatients.csv.gz\033[00m"
[11] "│   └── [   53014503]  \033[01;31mtransfers.csv.gz\033[00m"
[12] "├── [        672]  \033[01;34mhosp\033[00m"
[13] "│   ├── [     430049]  \033[01;31md_hcpcs.csv.gz\033[00m"
[14] "│   ├── [     863239]  \033[01;31md_icd_diagnoses.csv.gz\033[00m"
[15] "│   ├── [     579998]  \033[01;31md_icd_procedures.csv.gz\033[00m"
[16] "│   ├── [      14898]  \033[01;31md_labitems.csv.gz\033[00m"
[17] "│   ├── [   29531152]  \033[01;31mdiagnoses_icd.csv.gz\033[00m"
[18] "│   ├── [   11684062]  \033[01;31mdrgcodes.csv.gz\033[00m"
[19] "│   ├── [  515763427]  \033[01;31memar.csv.gz\033[00m"
[20] "│   ├── [  476252563]  \033[01;31memar_detail.csv.gz\033[00m"
[21] "│   ├── [    2098831]  \033[01;31mhcpcsevents.csv.gz\033[00m"
[22] "│   ├── [       2325]  index.html"
[23] "│   ├── [ 2091865786]  \033[01;31mlabevents.csv.gz\033[00m"
[24] "│   ├── [  171624288]  \033[01;31mlabevents_filtered_itemid.csv.gz\033[00m"
[25] "│   ├── [   99133381]  \033[01;31mmicrobiologyevents.csv.gz\033[00m"
[26] "│   ├── [  422874088]  \033[01;31mpharmacy.csv.gz\033[00m"
[27] "│   ├── [  501381155]  \033[01;31mpoe.csv.gz\033[00m"
[28] "│   ├── [   24020923]  \033[01;31mpoe_detail.csv.gz\033[00m"
[29] "│   ├── [  367041717]  \033[01;31mprescriptions.csv.gz\033[00m"
[30] "│   ├── [    7750325]  \033[01;31mprocedures_icd.csv.gz\033[00m"
[31] "│   └── [    9565293]  \033[01;31mservices.csv.gz\033[00m"
[32] "├── [        352]  \033[01;34micu\033[00m"
[33] "│   ├── [ 2350783547]  \033[01;31mchartevents.csv.gz\033[00m"
[34] "│   ├── [  110272408]  \033[01;31mchartevents_filtered_itemid.csv.gz\033[00m"
[35] "│   ├── [      55917]  \033[01;31md_items.csv.gz\033[00m"
[36] "│   ├── [   43296273]  \033[01;31mdatetimeevents.csv.gz\033[00m"
[37] "│   ├── [    2848628]  \033[01;31micustays.csv.gz\033[00m"
[38] "│   ├── [       1103]  index.html"
[39] "│   ├── [  352443512]  \033[01;31minputevents.csv.gz\033[00m"
[40] "│   ├── [   37095672]  \033[01;31moutputevents.csv.gz\033[00m"
[41] "│   └── [   20567368]  \033[01;31mprocedureevents.csv.gz\033[00m"
[42] "└── [        797]  index.html"
[43] ""
[44] "4 directories, 37 files"
Read CSVs and deposit to an SQLite database
Here, we will import only one csv file icustays.csv.gz for demonstration purpose. Motivated students can write a bash script for loading all MIMIC-IV data files into a SQLite database and contribute to https://github.com/MIT-LCP/mimic-code .
Create an empty database file mimiciv.sqlite:
<- 'touch mimiciv.sqlite' system (cmd, intern = TRUE )
Deposit the icu/icustatys.csv.gz file:
# delete icustays table if exists <- "sqlite3 mimiciv.sqlite 'DROP TABLE IF EXISTS icustays;'" system (cmd, intern = TRUE )
Create an empty icustays table with data types. Because SQLite does not support date-time data type (https://www.sqlite.org/datatype3.html ), we store intime and outtime as TEXT.
<- "sqlite3 mimiciv.sqlite 'CREATE TABLE icustays (subject_id INTEGER, hadm_id INTEGER, stay_id INTEGER, first_careunit TEXT, last_careunit TEXT, intime TEXT, outtime TEXT, los REAL)'" system (cmd, intern = TRUE )
<- str_c (mimic_path, "/icu/icustays.csv.gz" )<- str_c ("zcat < " ," | tail -n +2 | " ,"sqlite3 mimiciv.sqlite -csv " ,"'.import /dev/stdin icustays'"
[1] "zcat < ~/mimic/icu/icustays.csv.gz | tail -n +2 | sqlite3 mimiciv.sqlite -csv '.import /dev/stdin icustays'"
Execute the bash command:
system (cmd, intern = TRUE )
Read data from database
Connect to the database mimiciii.sqlite and list the tables:
<- dbConnect (RSQLite:: SQLite (), dbname = "./mimiciv.sqlite" dbListTables (con)
Read the table icustays:
<- tbl (con, "icustays" ) %>% print (width = Inf )
# Source:   table<icustays> [?? x 8]
# Database: sqlite 3.40.0 [/Users/huazhou/Documents/github.com/ucla-biostat-203b/2023winter/slides/12-dbplyr/mimiciv.sqlite]
   subject_id  hadm_id  stay_id first_careunit
        <int>    <int>    <int> <chr>
 1   17867402 24528534 31793211 Trauma SICU (TSICU)
 2   14435996 28960964 31983544 Trauma SICU (TSICU)
 3   17609946 27385897 33183475 Trauma SICU (TSICU)
 4   18966770 23483021 34131444 Trauma SICU (TSICU)
 5   12776735 20817525 34547665 Neuro Stepdown
 6   10215159 24283593 34569476 Trauma SICU (TSICU)
 7   14489052 26516390 35056286 Trauma SICU (TSICU)
 8   15914763 28906020 36909804 Trauma SICU (TSICU)
 9   16256226 20013290 39289362 Neuro Stepdown
10   19194449 21641999 39387567 Coronary Care Unit (CCU)
   last_careunit            intime              outtime               los
   <chr>                    <chr>               <chr>               <dbl>
 1 Trauma SICU (TSICU)      2154-03-03 04:11:00 2154-03-04 18:16:56 1.59
 2 Trauma SICU (TSICU)      2150-06-19 17:57:00 2150-06-22 18:33:54 3.03
 3 Trauma SICU (TSICU)      2138-02-05 18:54:00 2138-02-15 12:42:05 9.74
 4 Trauma SICU (TSICU)      2123-10-25 10:35:00 2123-10-25 18:59:47 0.351
 5 Neuro Stepdown           2200-07-12 00:33:00 2200-07-13 16:44:40 1.67
 6 Trauma SICU (TSICU)      2124-09-20 15:05:29 2124-09-21 22:06:58 1.29
 7 Trauma SICU (TSICU)      2118-10-26 10:33:56 2118-10-26 20:28:10 0.413
 8 Trauma SICU (TSICU)      2176-12-14 12:00:00 2176-12-17 11:47:01 2.99
 9 Neuro Stepdown           2150-12-20 16:09:08 2150-12-21 14:58:40 0.951
10 Coronary Care Unit (CCU) 2123-11-12 02:53:35 2123-11-12 13:52:03 0.457
# … with more rows
How many rows?
%>% show_query () %>% summarise (n = n ())
<SQL>
SELECT *
FROM `icustays`
# Source:   SQL [1 x 1]
# Database: sqlite 3.40.0 [/Users/huazhou/Documents/github.com/ucla-biostat-203b/2023winter/slides/12-dbplyr/mimiciv.sqlite]
      n
  <int>
1 76540
Use dplyr with SQLite
Keep the first ICU stay for each patient:
<- icustays_tble %>% # first ICU stay of each unique `subject_id` group_by (subject_id) %>% slice_min (intime) %>% ungroup () %>% # arrange(intime, .by_group = TRUE) %>% # slice_head(n = 1) %>% # left_join(icustays_tble, by = c("subject_id", "intime")) %>% show_query () %>% print (width = Inf )
<SQL>
SELECT
  `subject_id`,
  `hadm_id`,
  `stay_id`,
  `first_careunit`,
  `last_careunit`,
  `intime`,
  `outtime`,
  `los`
FROM (
  SELECT *, RANK() OVER (PARTITION BY `subject_id` ORDER BY `intime`) AS `q01`
  FROM `icustays`
)
WHERE (`q01` <= 1)
# Source:   SQL [?? x 8]
# Database: sqlite 3.40.0 [/Users/huazhou/Documents/github.com/ucla-biostat-203b/2023winter/slides/12-dbplyr/mimiciv.sqlite]
   subject_id  hadm_id  stay_id first_careunit
        <int>    <int>    <int> <chr>
 1   10000032 29079034 39553978 Medical Intensive Care Unit (MICU)
 2   10000980 26913865 39765666 Medical Intensive Care Unit (MICU)
 3   10001217 24597018 37067082 Surgical Intensive Care Unit (SICU)
 4   10001725 25563031 31205490 Medical/Surgical Intensive Care Unit (MICU/SICU)
 5   10001884 26184834 37510196 Medical Intensive Care Unit (MICU)
 6   10002013 23581541 39060235 Cardiac Vascular Intensive Care Unit (CVICU)
 7   10002155 23822395 33685454 Coronary Care Unit (CCU)
 8   10002223 22494570 39638202 Trauma SICU (TSICU)
 9   10002348 22725460 32610785 Neuro Intermediate
10   10002428 28662225 33987268 Medical Intensive Care Unit (MICU)
   last_careunit                                    intime
   <chr>                                            <chr>
 1 Medical Intensive Care Unit (MICU)               2180-07-23 14:00:00
 2 Medical Intensive Care Unit (MICU)               2189-06-27 08:42:00
 3 Surgical Intensive Care Unit (SICU)              2157-11-20 19:18:02
 4 Medical/Surgical Intensive Care Unit (MICU/SICU) 2110-04-11 15:52:22
 5 Medical Intensive Care Unit (MICU)               2131-01-11 04:20:05
 6 Cardiac Vascular Intensive Care Unit (CVICU)     2160-05-18 10:00:53
 7 Coronary Care Unit (CCU)                         2129-08-04 12:45:00
 8 Trauma SICU (TSICU)                              2158-01-15 08:01:49
 9 Neuro Intermediate                               2112-11-30 23:24:00
10 Medical Intensive Care Unit (MICU)               2156-04-12 16:24:18
   outtime               los
   <chr>               <dbl>
 1 2180-07-23 23:50:47 0.410
 2 2189-06-27 20:38:27 0.498
 3 2157-11-21 22:08:00 1.12
 4 2110-04-12 23:59:56 1.34
 5 2131-01-20 08:27:30 9.17
 6 2160-05-19 17:33:33 1.31
 7 2129-08-10 17:02:38 6.18
 8 2158-01-16 15:19:24 1.30
 9 2112-12-10 18:25:13 9.79
10 2156-04-17 15:57:08 4.98
# … with more rows
How many rows in icustays_subset?
%>% show_query () %>% summarise (n = n ())
<SQL>
SELECT
  `subject_id`,
  `hadm_id`,
  `stay_id`,
  `first_careunit`,
  `last_careunit`,
  `intime`,
  `outtime`,
  `los`
FROM (
  SELECT *, RANK() OVER (PARTITION BY `subject_id` ORDER BY `intime`) AS `q01`
  FROM `icustays`
)
WHERE (`q01` <= 1)
# Source:   SQL [1 x 1]
# Database: sqlite 3.40.0 [/Users/huazhou/Documents/github.com/ucla-biostat-203b/2023winter/slides/12-dbplyr/mimiciv.sqlite]
      n
  <int>
1 53150
SQL query
show_query usefully shows the SQL query translated from dplyr query.
[1] "tbl_SQLiteConnection" "tbl_dbi"              "tbl_sql"
[4] "tbl_lazy"             "tbl"
show_query (icustays_subset)
<SQL>
SELECT
  `subject_id`,
  `hadm_id`,
  `stay_id`,
  `first_careunit`,
  `last_careunit`,
  `intime`,
  `outtime`,
  `los`
FROM (
  SELECT *, RANK() OVER (PARTITION BY `subject_id` ORDER BY `intime`) AS `q01`
  FROM `icustays`
)
WHERE (`q01` <= 1)
SQL translation
dbplyr package (a dplyr backend for databases) has a function, translate_sql, that lets you experiment with how R functions are translated to SQL:
translate_sql (x == 1 & (y < 2 | z > 3 ))
<SQL> `x` = 1.0 AND (`y` < 2.0 OR `z` > 3.0)
translate_sql (x ^ 2 < 10 )
<SQL> (POWER(`x`, 2.0)) < 10.0
translate_sql (x %% 2 == 10 )translate_sql (paste (x, y))
<SQL> CONCAT_WS(' ', `x`, `y`)
Warning: Missing values are always removed in SQL aggregation functions.
Use `na.rm = TRUE` to silence this warning
This warning is displayed once every 8 hours.
translate_sql (mean (x, na.rm = TRUE ))
Timings
Let’s compare the timings of dplyr (in-memory) and dbplyr (on disk database).
<- str_c (mimic_path, "/icu/icustays.csv.gz" )<- read_csv (csvfile)<- system.time (%>% group_by (subject_id) %>% summarize (n = n ())
   user  system elapsed
  0.580   0.018   0.599
<- tbl (con, "icustays" )<- system.time (%>% group_by (subject_id) %>% summarize (n = n ())
   user  system elapsed
  0.004   0.000   0.004
SQLite (0.004 seconds) was much faster than tibble (0.599 seconds). But SQLite is disk-based, while the tibble is in memory. Why is the discrepancy?
Laziness
dplyr/dbplyr uses lazy evaluation as much as possible, particularly when working with non-local backends.
When building a query, often we don’t want the entire table. We want just enough to check if our query is working.
Since we would prefer to run one complex query over many simple queries, laziness allows for verbs to be strung together.
Therefore, by default dbplyr
won’t connect and query the database until absolutely necessary (e.g. show output),
and unless explicitly told to, will only query a handful of rows to give a sense of what the result will look like
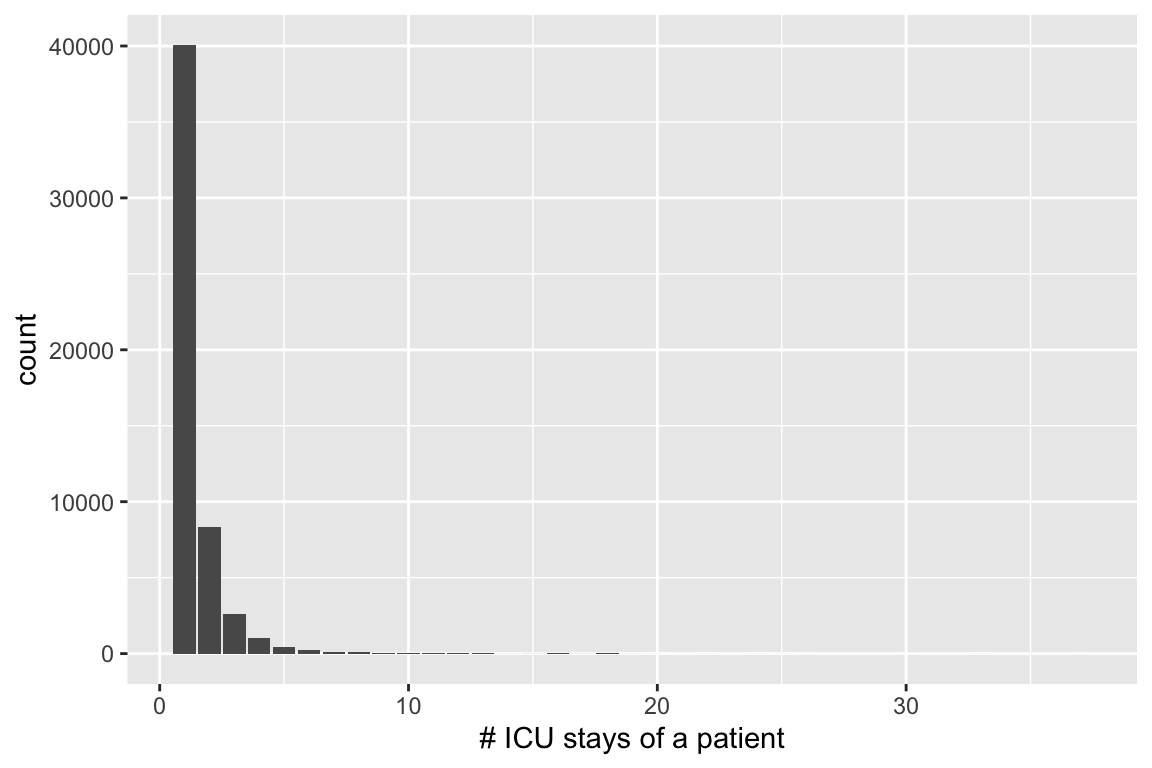
%>% group_by (subject_id) %>% summarize (n = n ())
# Source:   SQL [?? x 2]
# Database: sqlite 3.40.0 [/Users/huazhou/Documents/github.com/ucla-biostat-203b/2023winter/slides/12-dbplyr/mimiciv.sqlite]
   subject_id     n
        <int> <int>
 1   10000032     1
 2   10000980     1
 3   10001217     2
 4   10001725     1
 5   10001884     1
 6   10002013     1
 7   10002155     3
 8   10002223     1
 9   10002348     1
10   10002428     4
# … with more rows
Full query
To force a full query and return a complete table it is necessary to use the collect function.
system.time (%>% group_by (subject_id) %>% summarize (n = n ()) %>% collect ()
   user  system elapsed
  0.083   0.005   0.087
Close connection to database